visual prototyping

emotional state visualiser
prototype-visualiser 5.1: p5js visuals.

arduino-p5js visual translation. y3s2w13. completed 15 april 2024.

the translation of arduino data to p5js visuals.

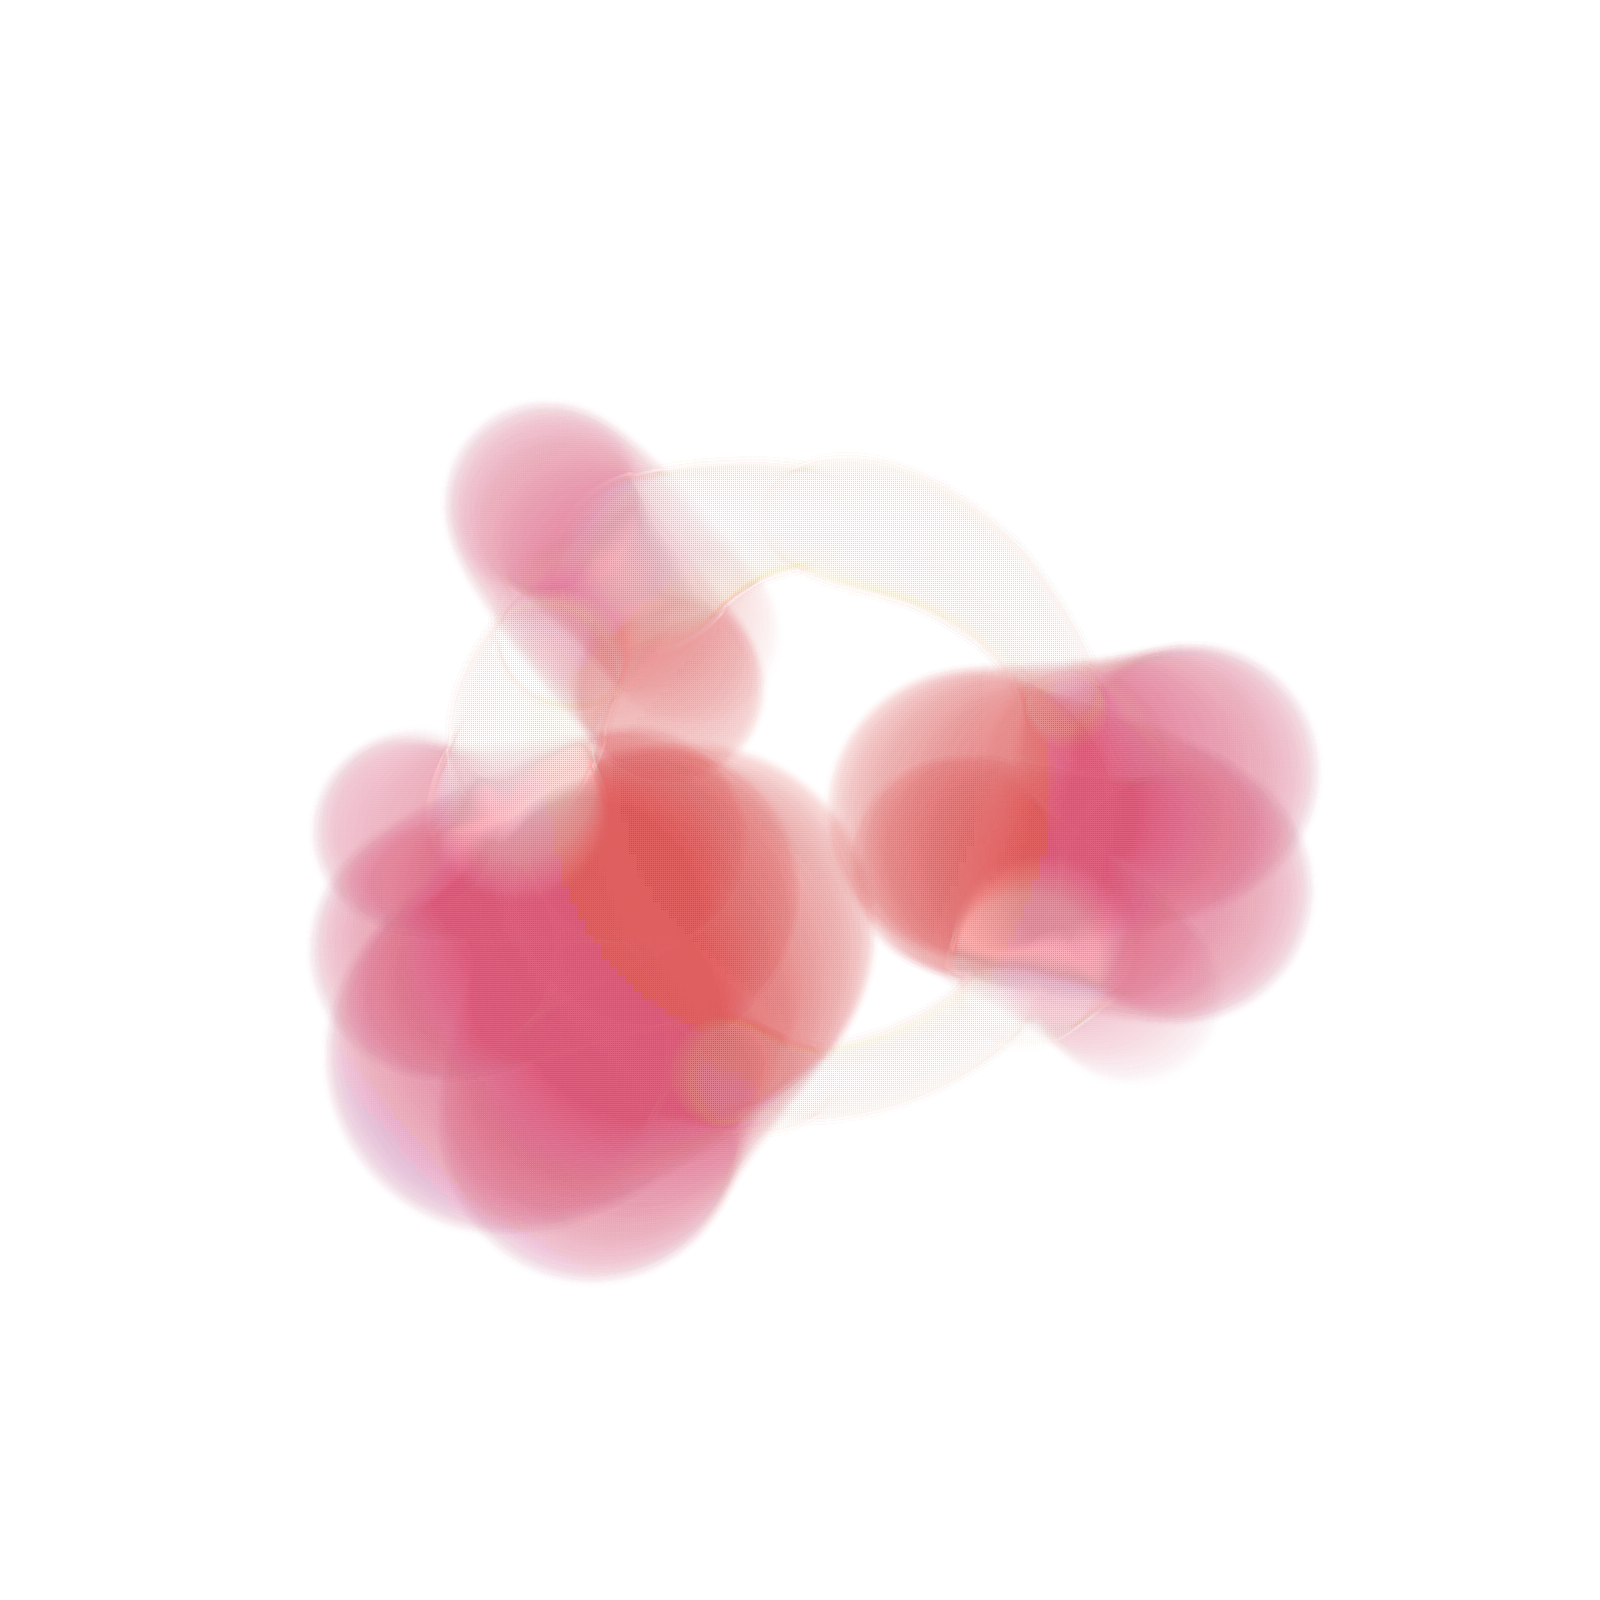
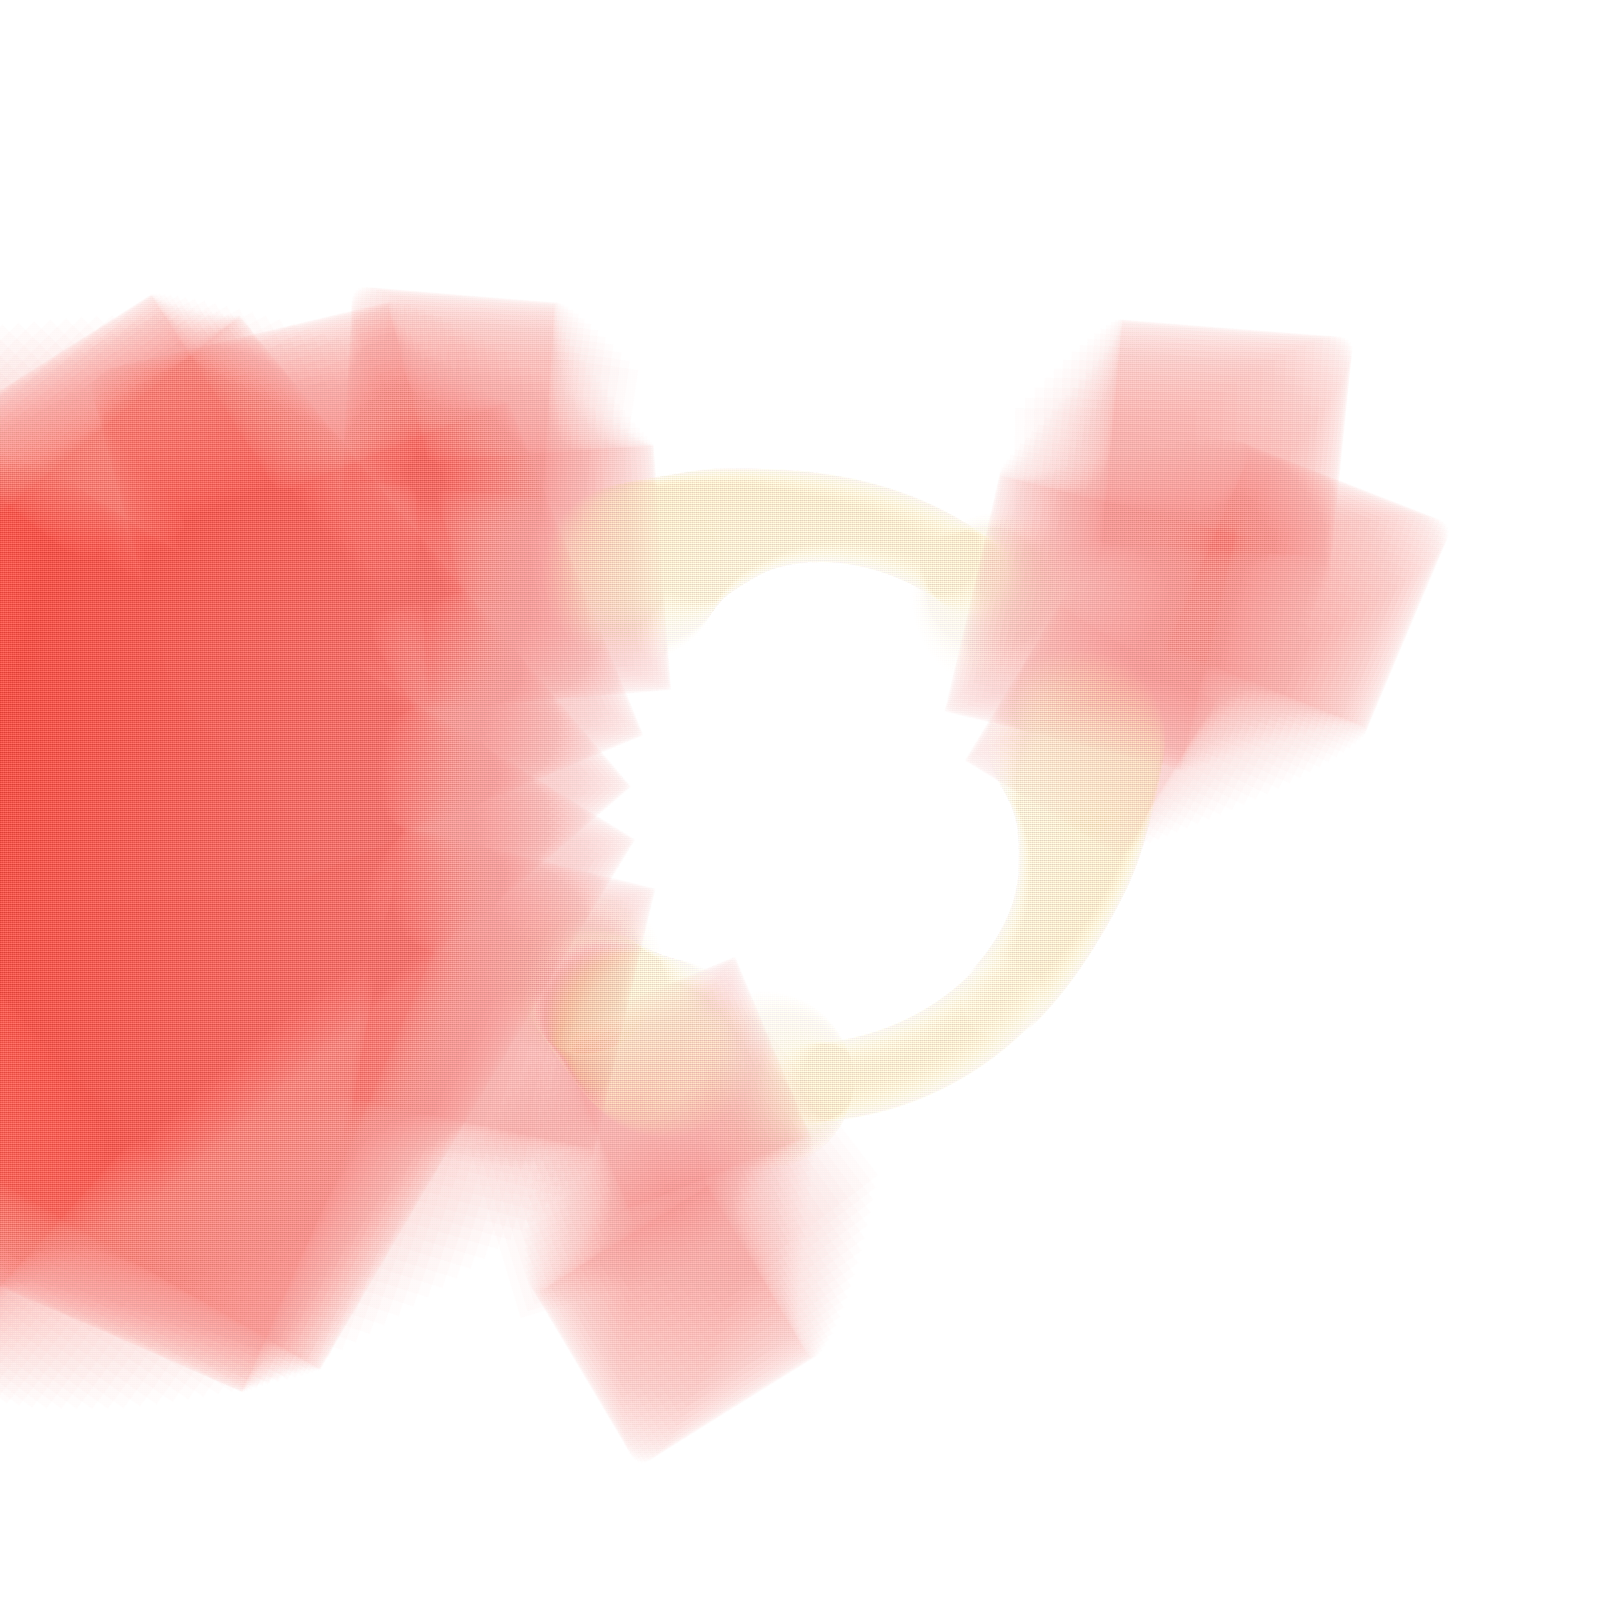
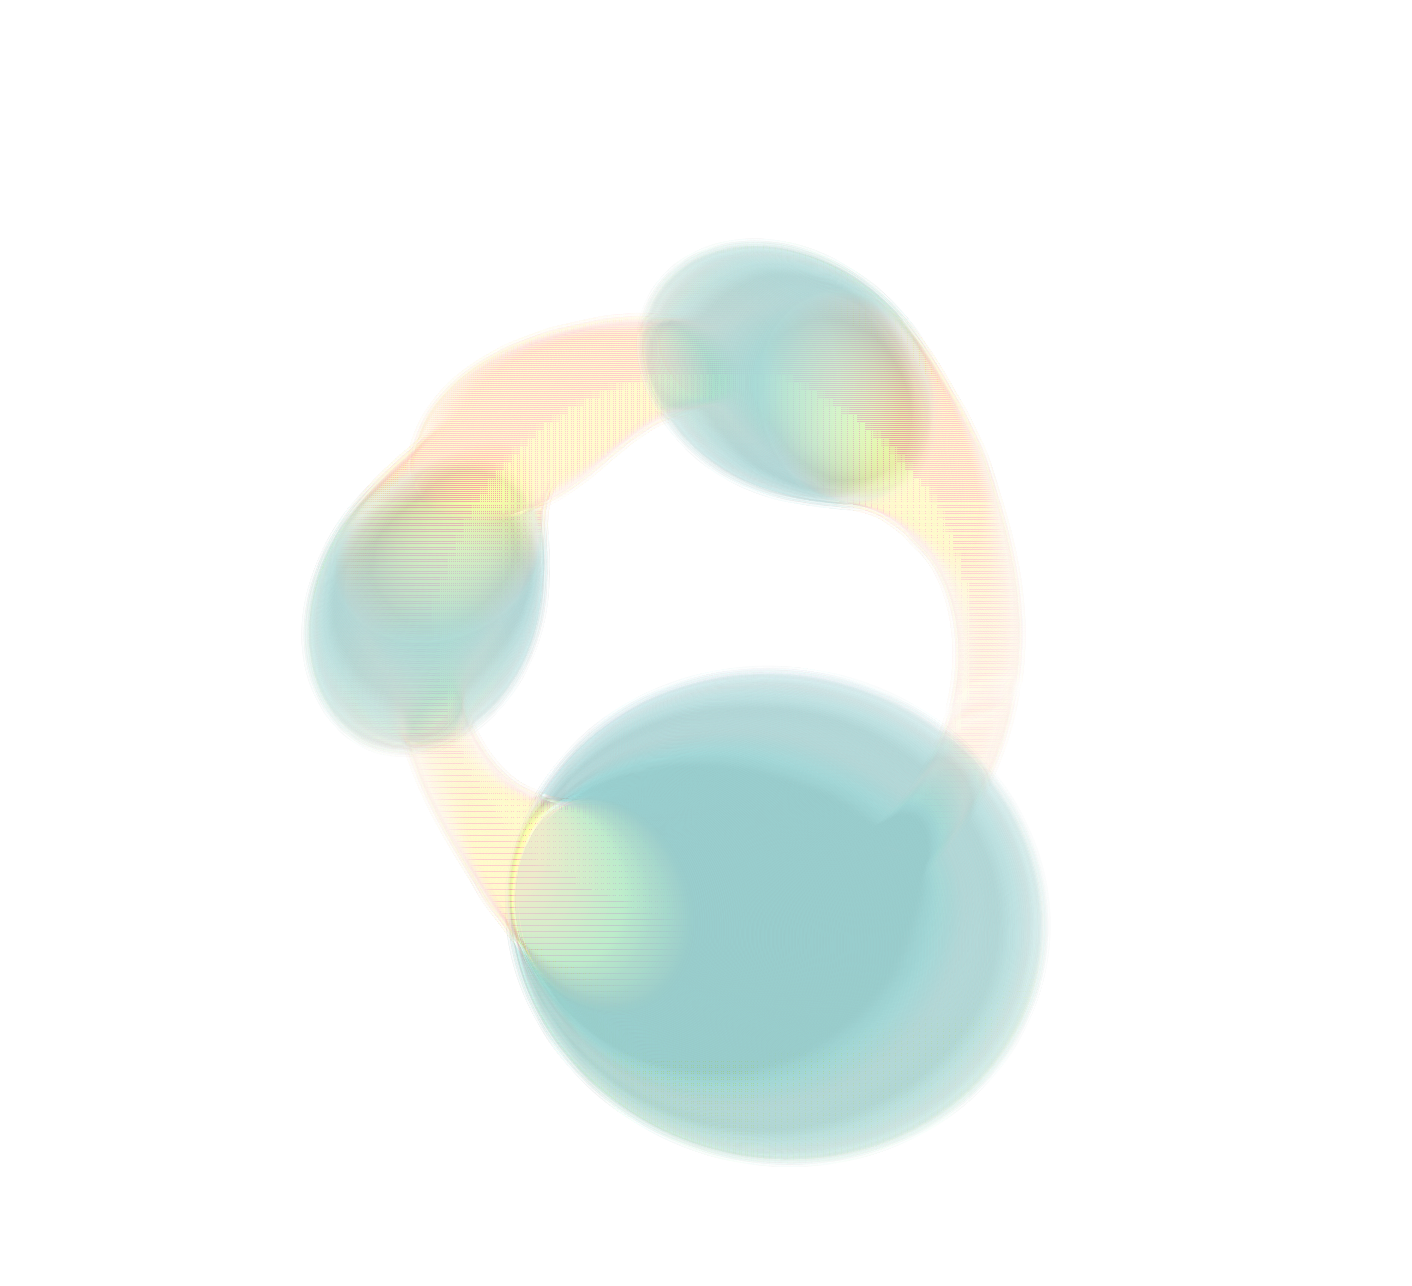
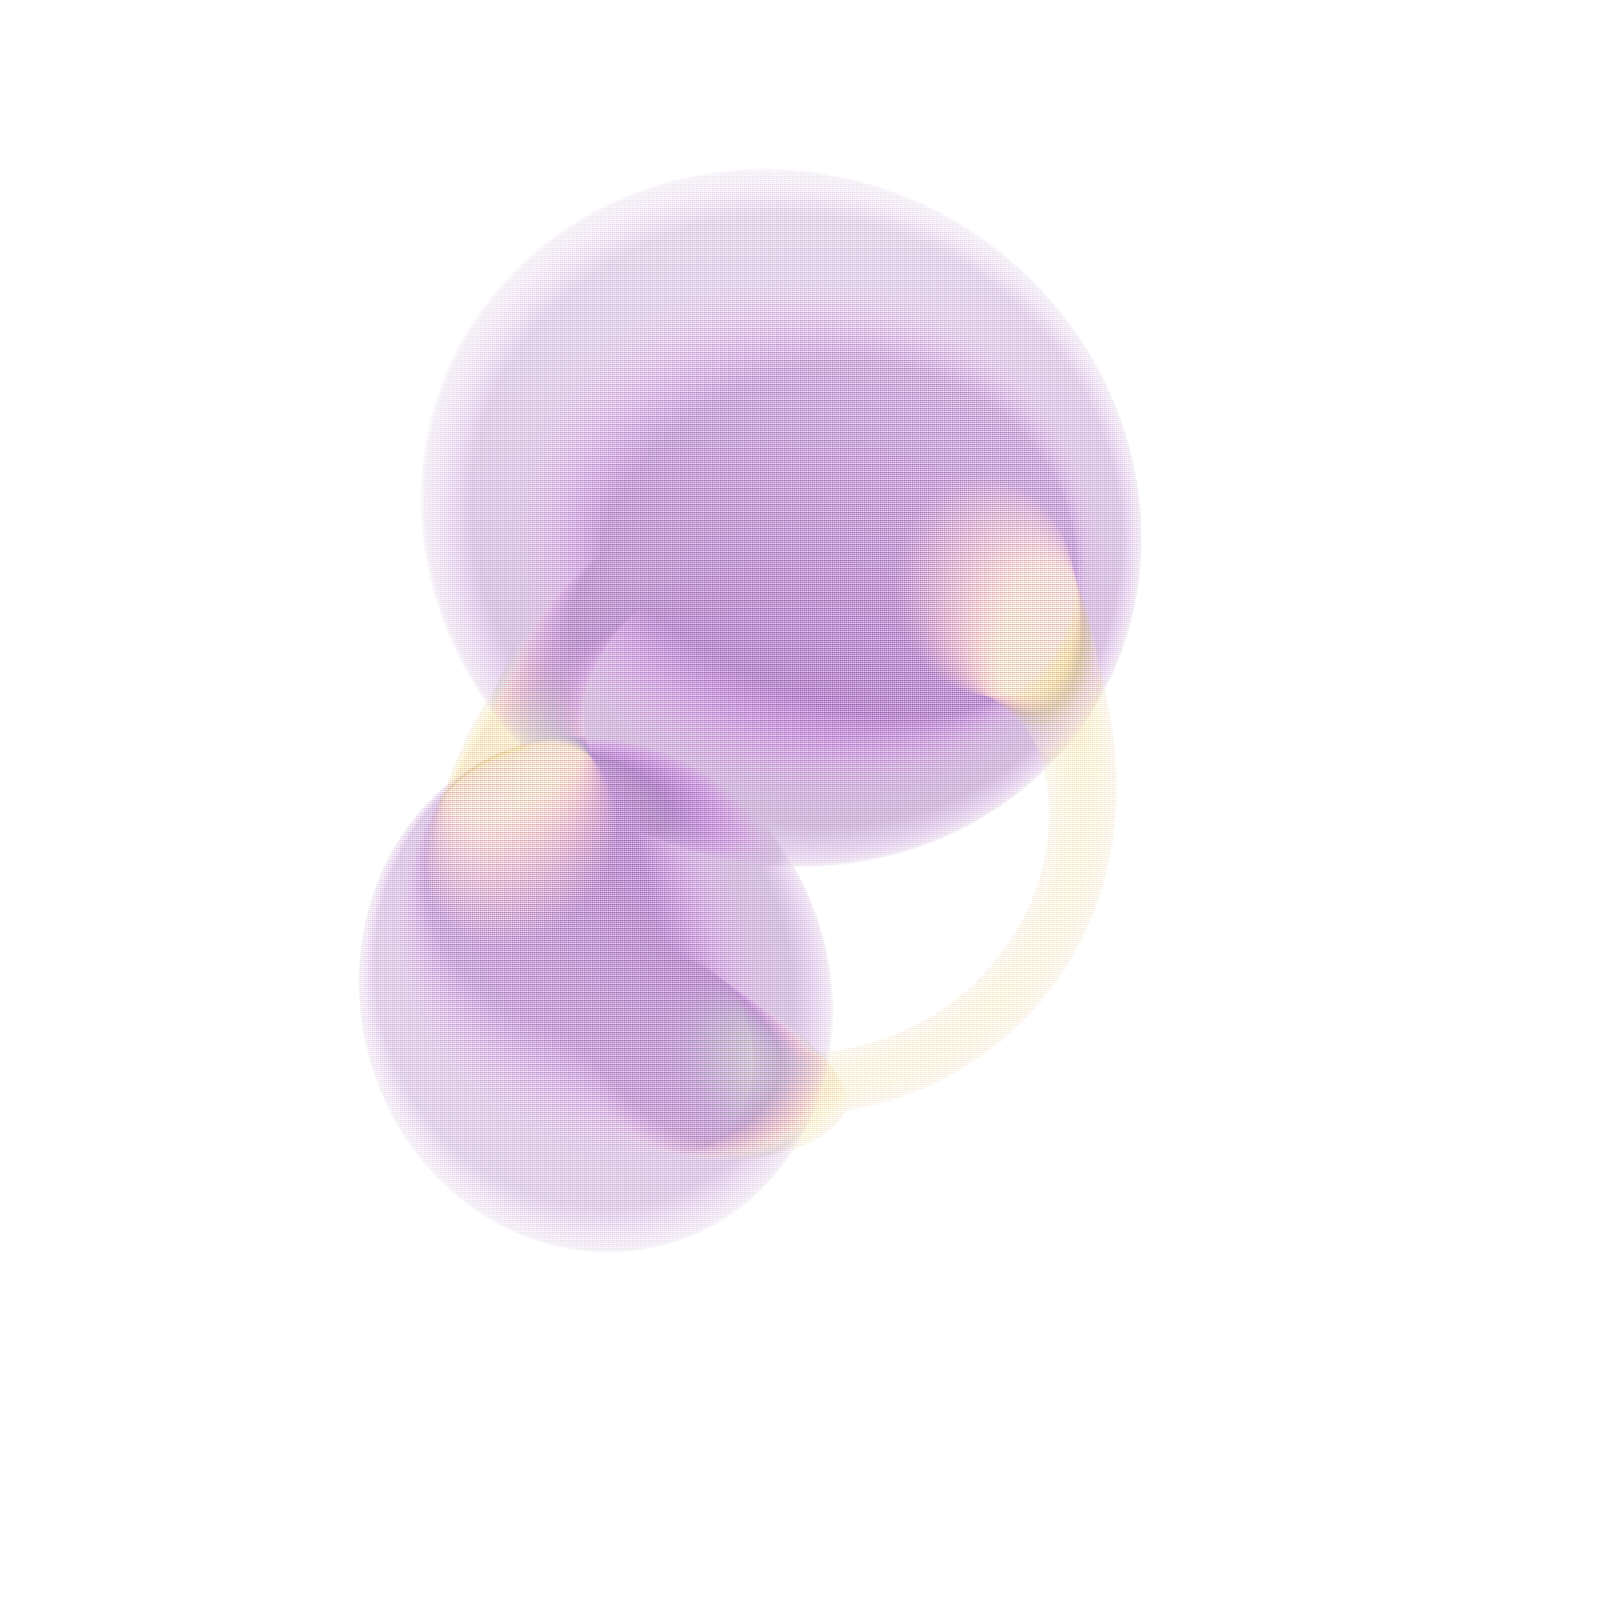
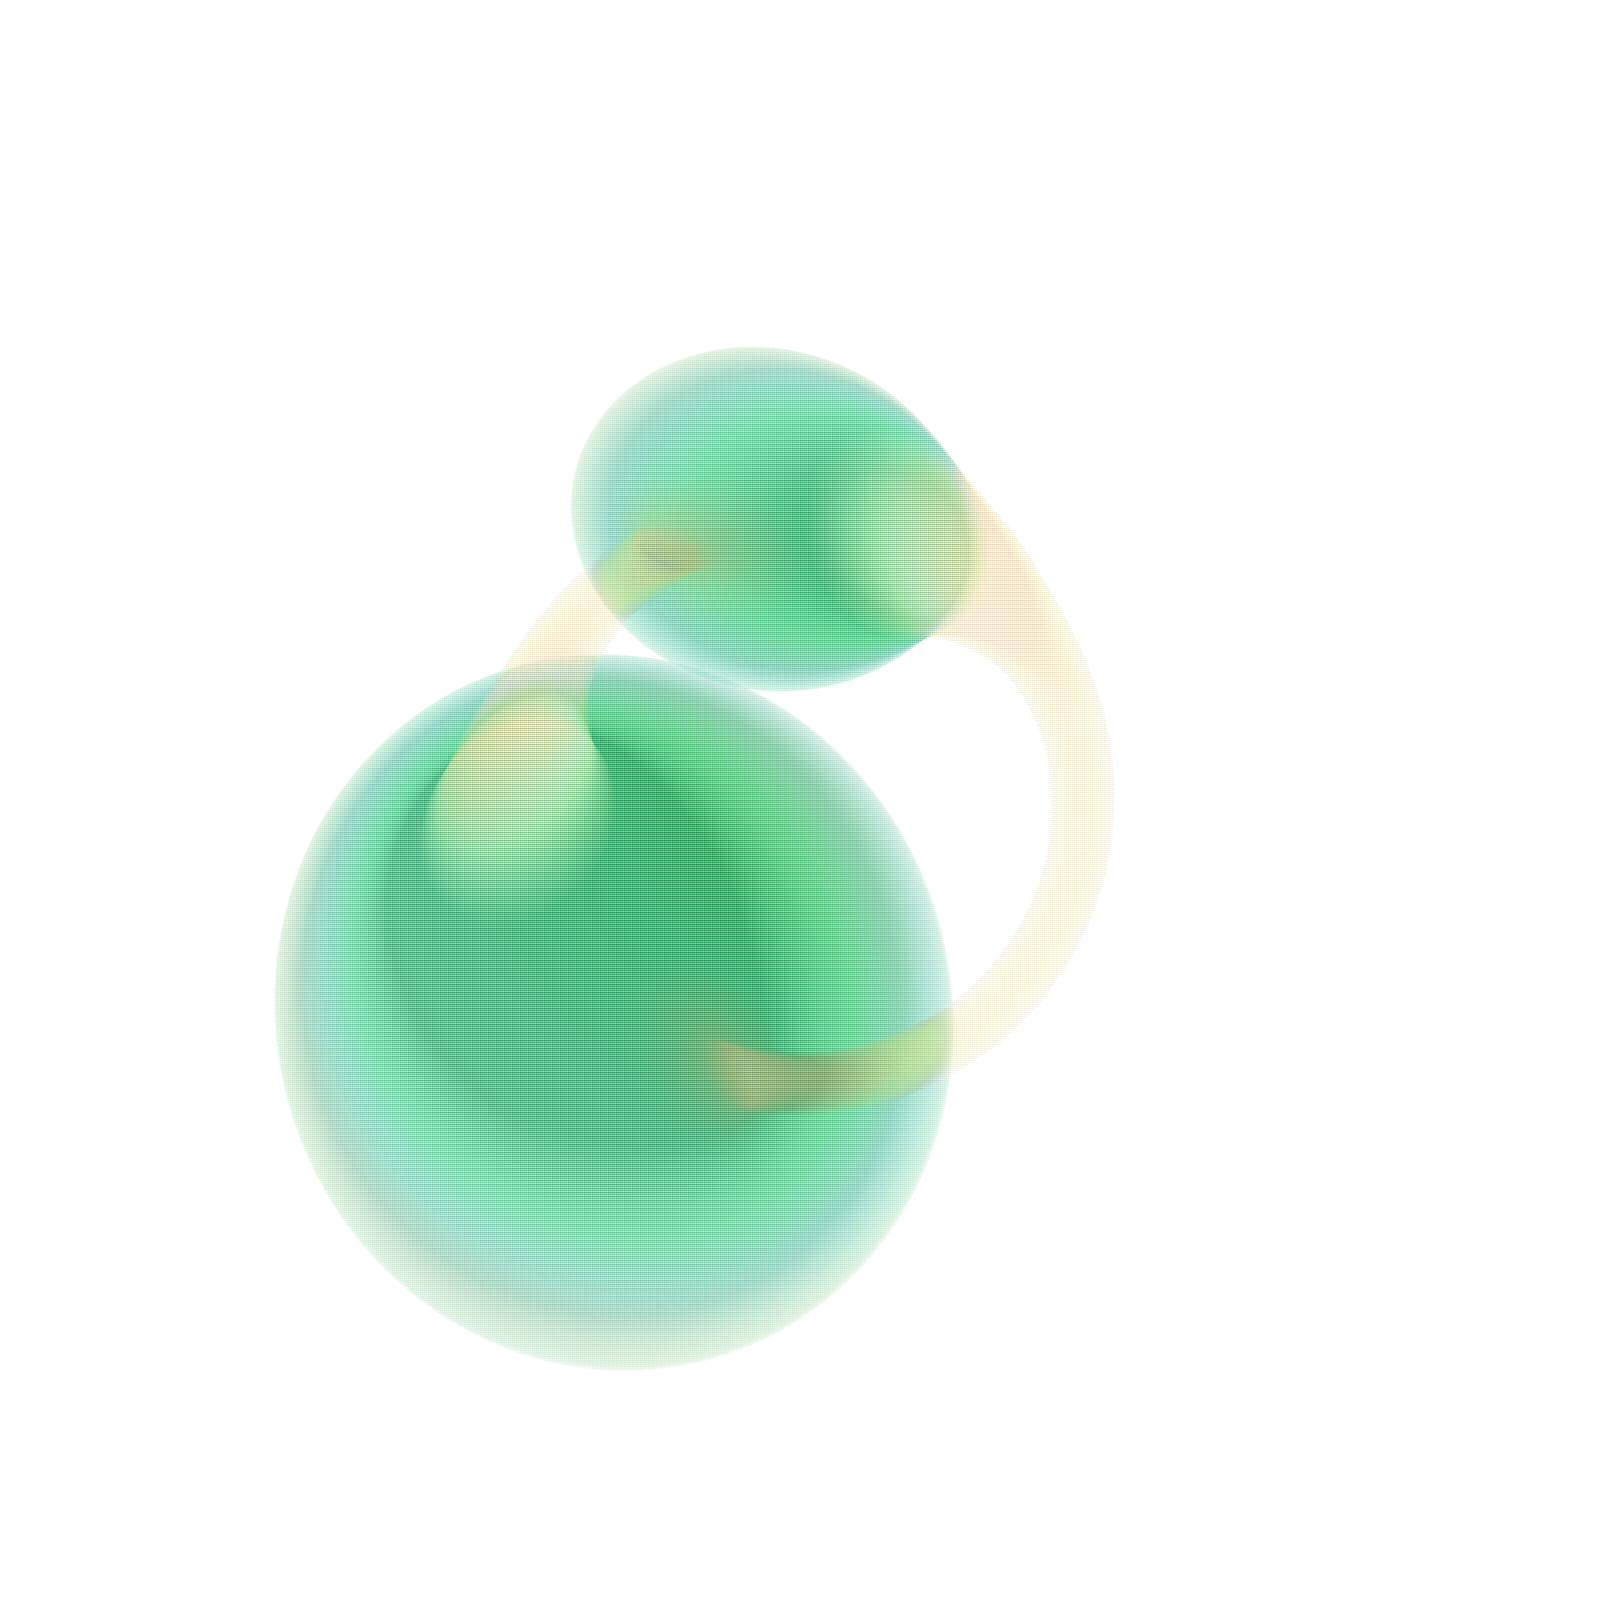
this came a long way from the initial visual experiments in semester 1. it's quite straightforward, levels of hopelessness was represented by enlarging circles, and frustration was represented by the erratic movement of triangles. the visuals were developed through constant use and feedback. i gathered that colours were viewed differently from individual to individual, and decided that there should not be a fixed colour scheme to express the two emotions.

link to prototype collection: abc-prototype.p5js

publication

300: a collection of emotional states over 300 days
prototype-visualiser 5.2: 300 visuals.

emotional state visualiser: publication. y3s2w15. completed 19 april 2024.

proposed use of the antidotes for bruised creatives.

one result of the visualiser will not be impactful enough to show off how it should be used. 300 is a collection of the visualiser over the course of 300 days. it shows off how frequently our emotions can change, and hopes to evoke some urgency in the user to practive healthier habits when their emotional state is declining.